Investment Return Calculator Complete Guide: Maximizing Your ROI in 2026
Knowing precisely how to calculate your investment return in 2026 separates disciplined wealth builders from passive savers watching inflation quietly erode their financial progress. This comprehensive companion guide walks through the exact formulas, realistic return rate benchmarks by asset class, proven portfolio growth strategies, and common mathematical mistakes investors make when projecting long-term compound returns.
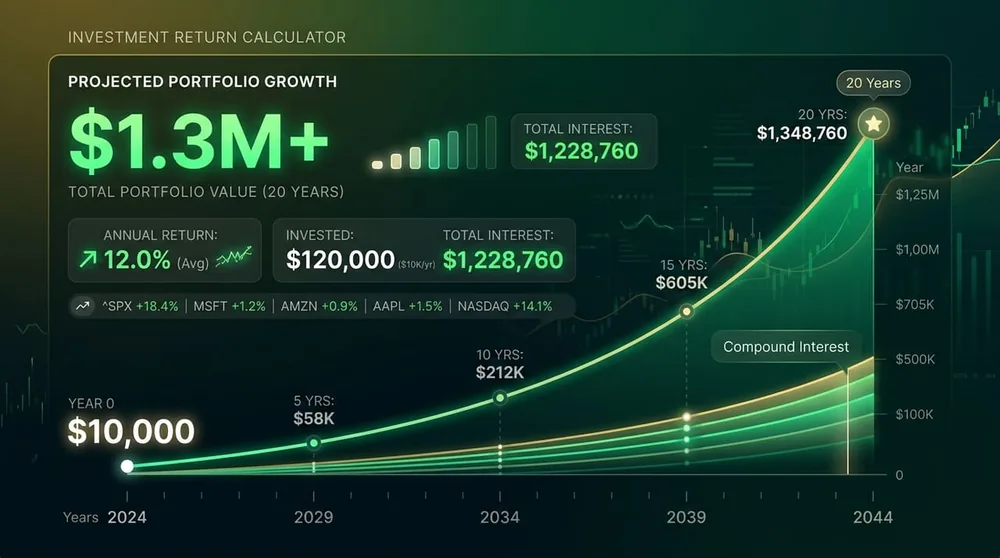
What is an Investment Return (ROI)?
Return on Investment (ROI) is the percentage gain or loss generated by an investment relative to the total amount of capital originally committed. In personal finance, the investment return calculation compares how much your portfolio has grown against the sum of your original principal plus all subsequent contributions across the full investment horizon.
ROI = ((Final Portfolio Value − Total Amount Invested) ÷ Total Amount Invested) × 100
Example: You invest $50,000 total over 10 years and your portfolio grows to $110,000.
ROI = ((110,000 − 50,000) ÷ 50,000) × 100 = 120% total return
While simple ROI measures total percentage growth, experienced investors typically reference CAGR (Compound Annual Growth Rate) — the smooth year-over-year equivalent growth rate — to enable fair apples-to-apples comparisons across different investment vehicles and time horizons. According to investment education resources published by the U.S. Securities and Exchange Commission (SEC), understanding compound growth mechanics is foundational to every informed investment decision.
Realistic Annual Return Rate Benchmarks by Asset Class (2026)
A key variable in our Investment Return Calculator is your chosen annual return rate. Use these evidence-based historical averages to select a realistic rate for your specific portfolio composition:
| Asset Class | Historical Avg. Return | Risk Level |
|---|---|---|
| S&P 500 Index Fund (e.g., VOO, SPY) | ~10% nominal / ~7% real | Medium-High |
| Total Bond Market Index Fund | 3–5% | Low |
| 60/40 Balanced Portfolio | 5–7% | Medium |
| High-Yield Savings / HYSA | 4–5% (2026) | None |
| Real Estate (REITs average) | 8–11% | Medium-High |
Investment Return Maximization Checklist
Before committing capital to any investment vehicle, validate your approach against our structured investment readiness checklist:
📋 5-Step Investment Return Maximization Checklist
- ✔️Build Your Emergency Fund First: Before investing beyond employer 401(k) matching, ensure you hold 3–6 months of living expenses in a liquid emergency fund. Investing without this safety net forces panic-selling during market downturns — destroying the compound returns you are trying to build.
- ✔️Minimize Investment Expense Ratios: A 1% annual expense ratio on a $100,000 portfolio costs $1,000 per year — compounding against you for decades. Prioritize low-cost index funds with expense ratios below 0.10% (e.g., Vanguard, Fidelity ZERO funds).
- ✔️Maximize Tax-Advantaged Accounts First: Contribute the full IRS-allowed annual limit to your 401(k) and Roth IRA before investing in taxable brokerage accounts. Tax-sheltered compound growth dramatically outperforms taxable equivalent returns over 20+ year horizons.
- ✔️Use Dollar-Cost Averaging (DCA): Invest a fixed dollar amount on a regular schedule (e.g., $500 every payday) regardless of market conditions. DCA eliminates costly timing attempts and automatically purchases more shares when prices are low.
- ✔️Rebalance Annually, Not Reactively: Set a calendar reminder to rebalance your target asset allocation once per year — not in response to market panic. Annual mechanical rebalancing enforces the discipline of selling high and buying low systematically.
Real-Life Scenario: Early Start vs. Late Start — A $500/Month Case Study
To illustrate the enormous mathematical advantage of starting your investment contributions early, compare these two identical investors who both contribute $500 per month at a 7% annual return:
💡 Case Study: Alex (Starts at 25) vs. Brian (Starts at 35)
Both Alex and Brian plan to retire at age 65. Both contribute exactly $500/month into an S&P 500 index fund earning a 7% average annual return. The key difference is that Alex starts at age 25 while Brian waits until 35.
Returns Generated: $1,072,000
Investment Period: 40 years
Returns Generated: $462,000
Investment Period: 30 years
❓ Frequently Asked Questions About Investment Returns
What is a realistic expected annual return rate to use in 2026?
For a diversified S&P 500 index fund, financial planners commonly use 7% as a conservative real (inflation-adjusted) annual return assumption, based on the index's historical long-run performance. For planning purposes, 6–8% nominal for a stock-heavy portfolio and 4–5% for a balanced 60/40 portfolio are widely accepted conservative benchmarks.
Does the Investment Return Calculator account for taxes?
Our Investment Return Calculator models pre-tax compound growth to show you the maximum theoretical portfolio potential. In taxable brokerage accounts, capital gains and dividend distributions are taxed annually, which reduces effective compound returns. In tax-advantaged accounts (401k, Roth IRA), your money compounds entirely tax-deferred or tax-free, making these vehicles mathematically superior for long-term wealth accumulation.
How is ROI different from CAGR?
ROI (Return on Investment) measures total percentage growth across the entire investment period without regard to time. CAGR (Compound Annual Growth Rate) converts that total return into a smooth, annualized rate, enabling fair comparison between investments held for different durations. For example, a 120% ROI over 10 years equals a CAGR of approximately 8.3% per year — calculated as (1 + 1.20)^(1/10) − 1.
Ready to model your real investment scenario?
🧮 Launch the Investment Return Calculator